

—————— GIS Projects ——————
Dissertation-Spatial-Temporal Traffic Accident Analysis in relation to EMS Response Time
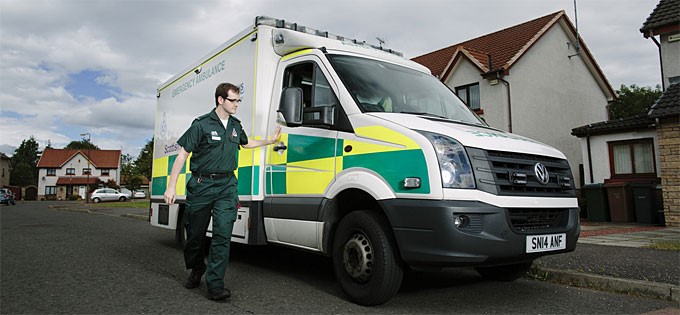 Fig. 1: Scottish Ambulance Services (source: Scottish Ambulance Service, 2019)
A ) Abstract
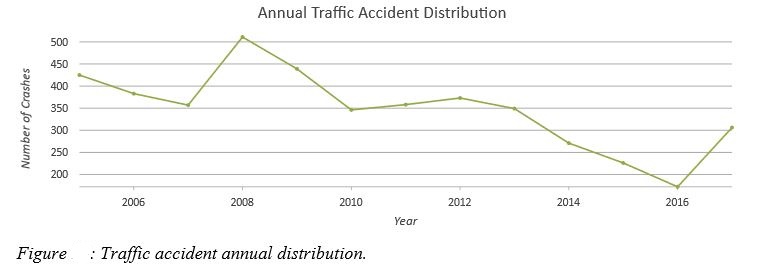
Traffic accidents constitute one of the dominant causes of death globally, influencing the welfare of modern society significantly. Aberdeen City is considered as one of the most traffic-congested cities in the UK, resulting in more than 180 incidents per year for the last 10-year period. The purpose of this study is to perform an accidents cluster analysis in the City of Aberdeen by examining both time and space aspects in relation to the Emergency Medical Services (EMS) response time. Performing network cluster analysis, new space-time accident hot spots are detected on the road network and then a composite examination between those hot spots and the EMS response time is performed.
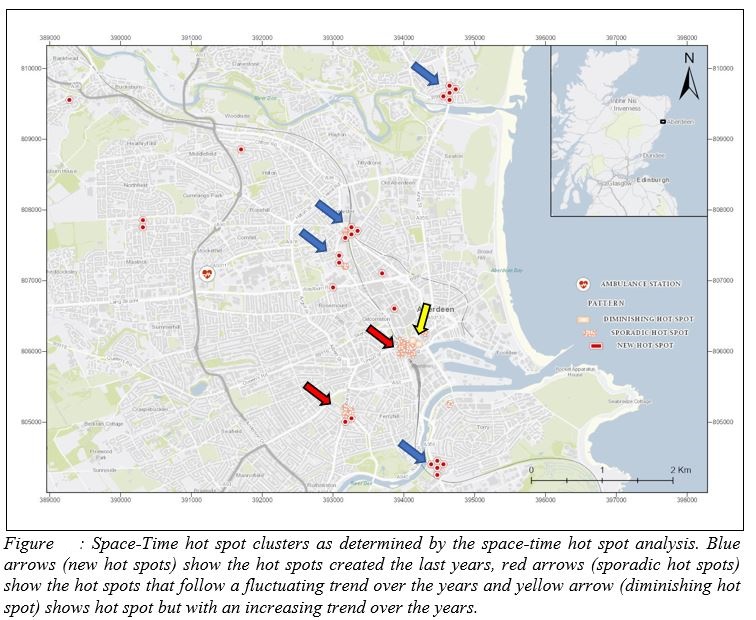
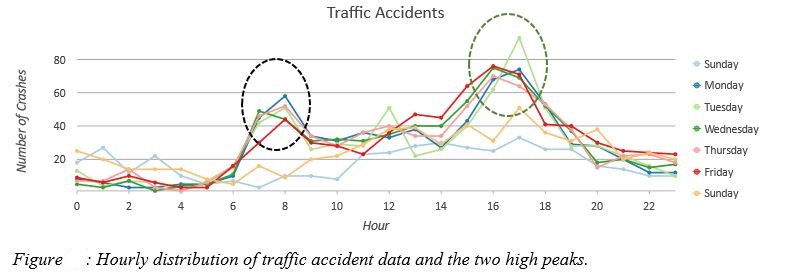
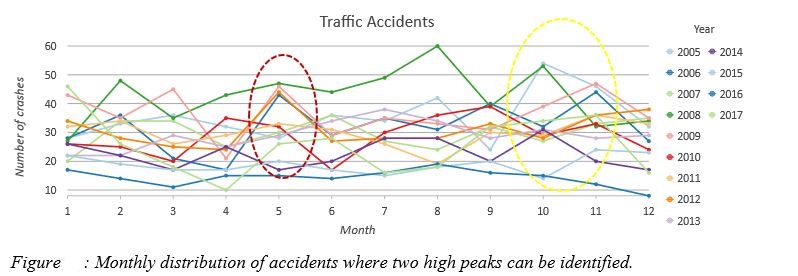
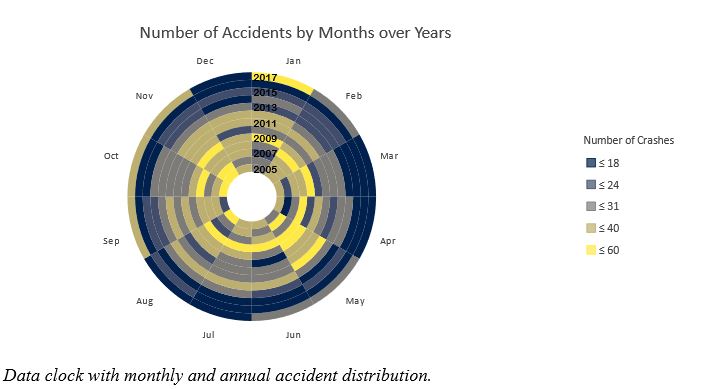
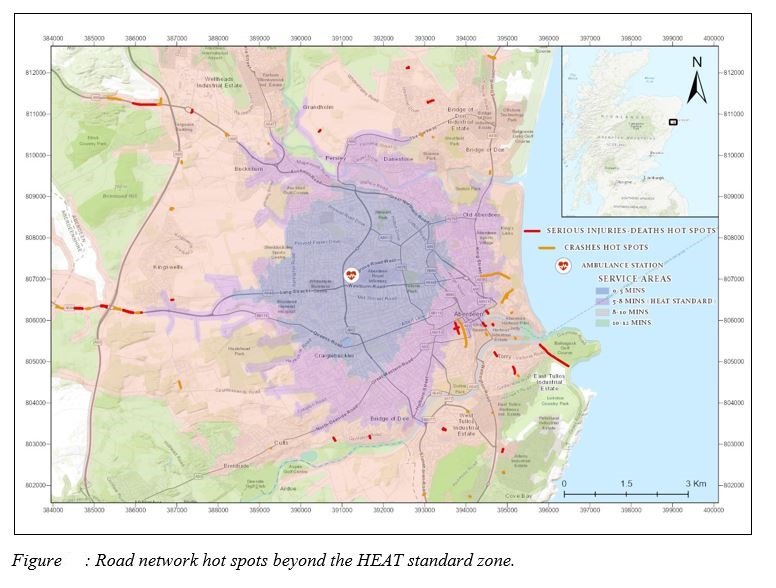
Throughout the performed analysis and examination of the traffic accident data, some new accident trends have been identified, during the last few years. Moreover, a high density of accidents takes place during specific day hours and months. Finally, most of the hot spots are located within the boundaries of the HEAT standard of 8 minutes, constituting the EMS station ideally situated. However, an emphasis should be given on those hot spots located farther than the 8-minutes zones, and further policies should be deployed against those prone areas.
B ) Methodology
1. Data Preparation
Data cleansing and validation is achieved so that data to be ready for use by the GIS software. The datasets contain information about traffic accidents in the UK, the road network and the location of the ambulance station. Afterwards, the data are analysed in a spatial-temporal framework revealing interesting space-time patterns.
Study Area
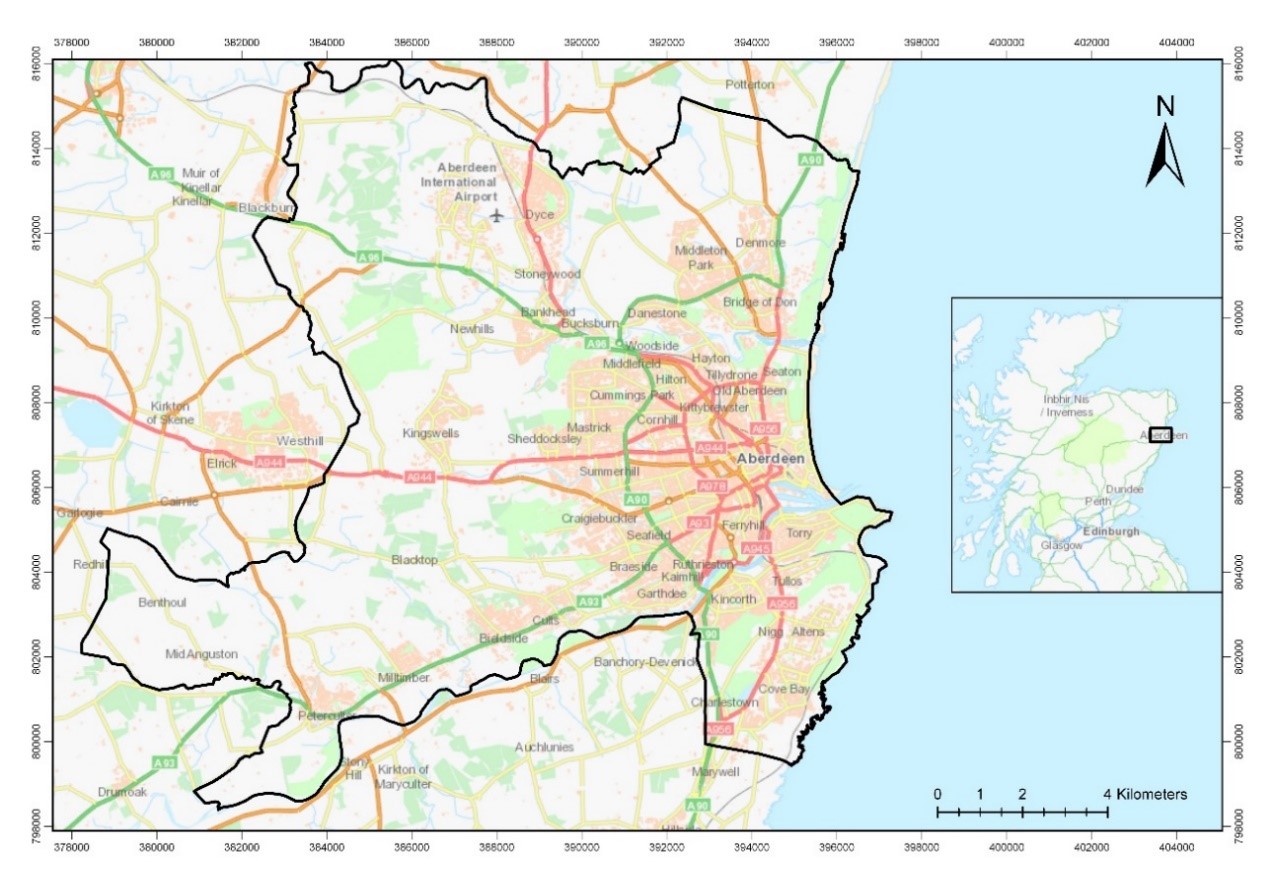 Fig. 2: The location of the study area in Scotland, UK.
Data Acquisition
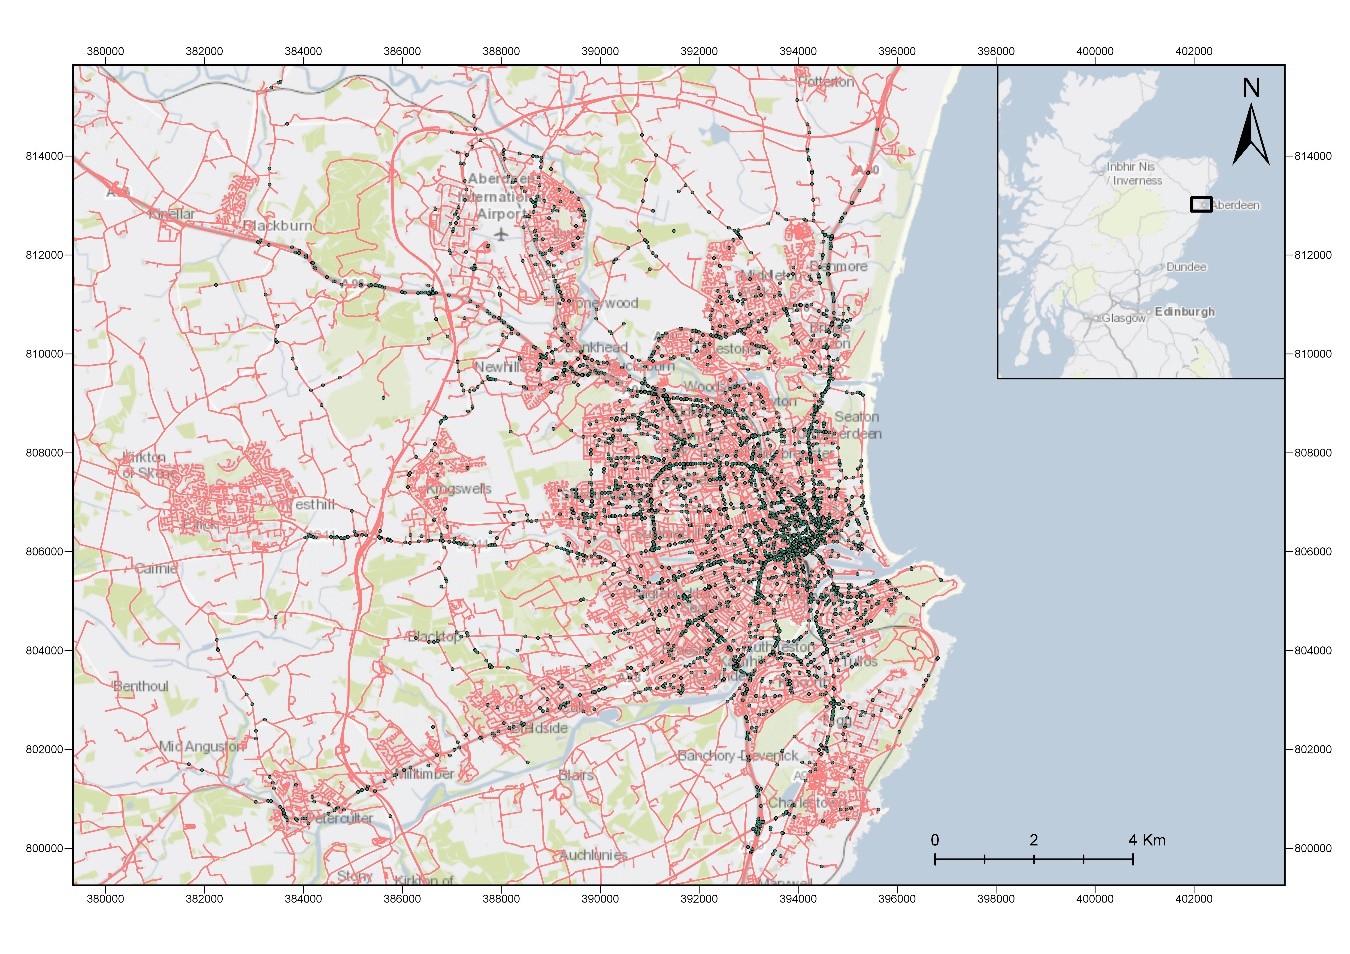 Fig. 3: Spatial distribution of traffic accidents between 2005 and 2017.
2. Accident Analysis
The road network dataset which is acquired with a UK national coverage, contains information on virtually every road segment across the UK. The road network was clipped into the extent of the boundaries of Aberdeen city in order to make the data manipulation easier and faster.
EMS Response Time Distribution
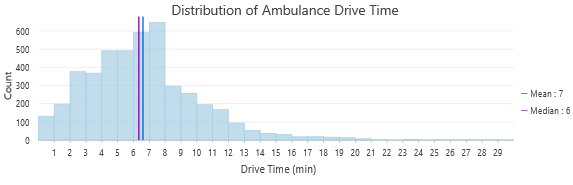 Fig. 4: Distribution of the time that an ambulance needs to reach the accident site.
Space-time patterns and Emerging Hot spots
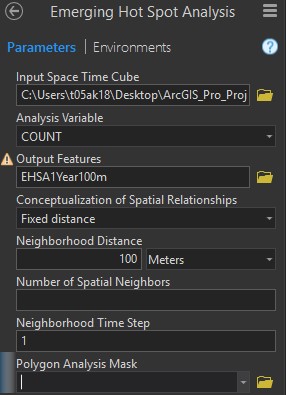
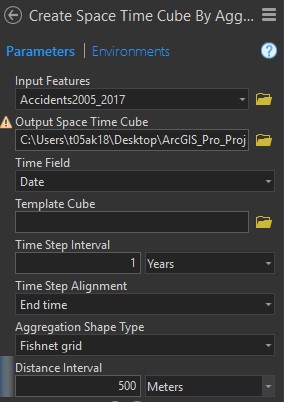 Fig. 5: Screen shots of the parameters used by the Create Space Time Cube by Aggregating Points and the Emerging Hot Spot Analysis tools.
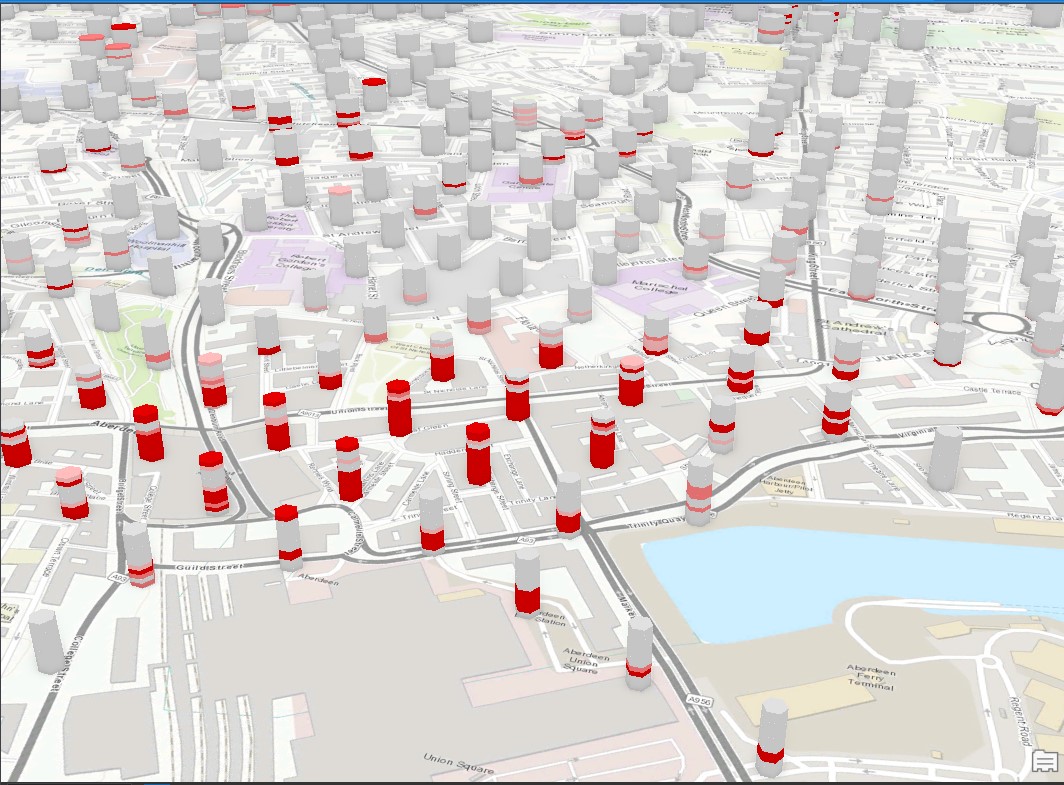 Fig. 6: Screenshot of the 3D visualisation of the space – time cube.
Stopping Sight Distance (SSD)
The distance needed for a vehicle to stop before colliding with something in the roadway \(SSD=(0.278*t*V)+V^2/(254*(f + G)\)
where:
\(SSD = Stopping\;Sight\;Distance\)
\(t: Reaction\;Time\;in\;Seconds ≃ 1.5\;sec\)
\(V: Car\;Speed\;in\;km/h ≃ road’s\;speed\;limit\)
\(G: Slope\;level = 0\)
\(f: Coefficient\;of\;friction\) 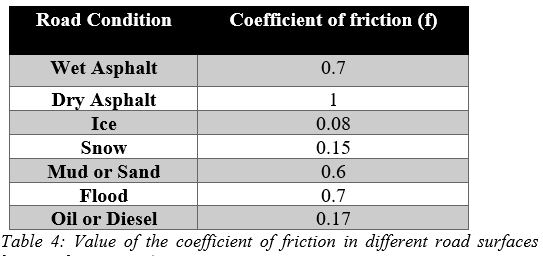
C ) Results
1. Ambulance Service Areas and Find Closest Facilities Layers
The Ambulance Service Areas Layer shows the regions that an ambulance can reach within different time-step intervals. In other words, it refers to the time needed for an ambulance to reach the accident location and depends on the network complexity and the road speed limit.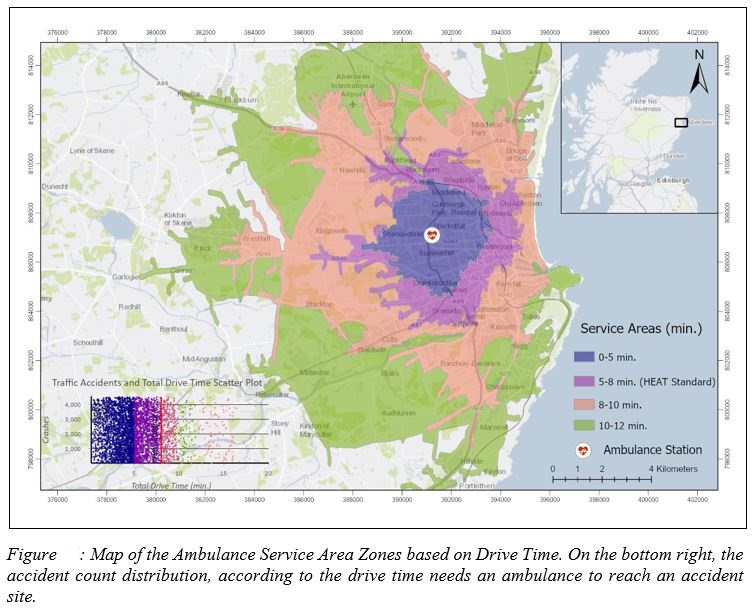
2. Space-time Hot Spot Analysis
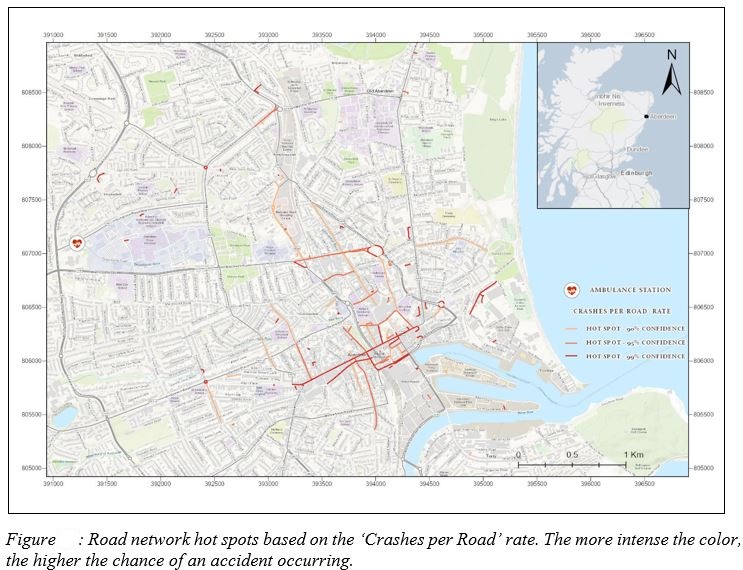
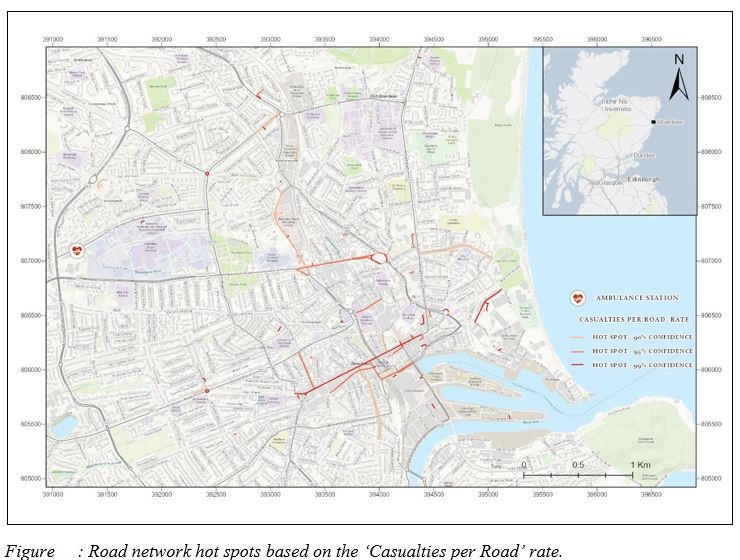
Accident Rates per Road
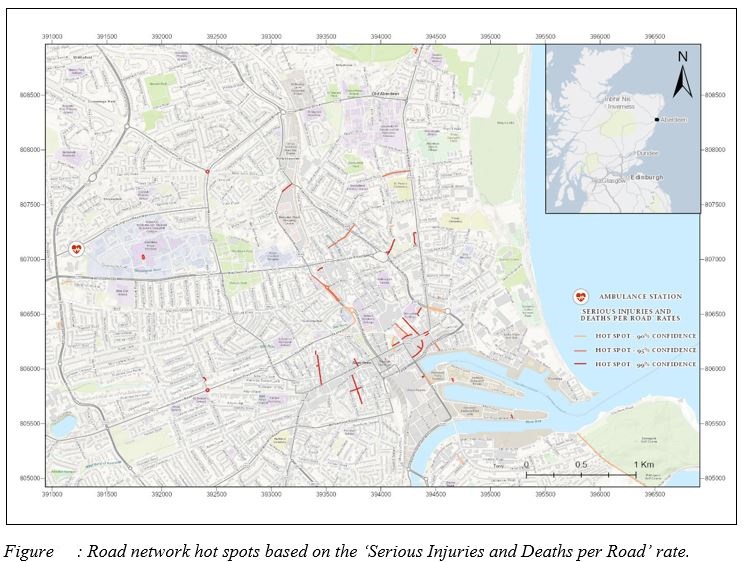
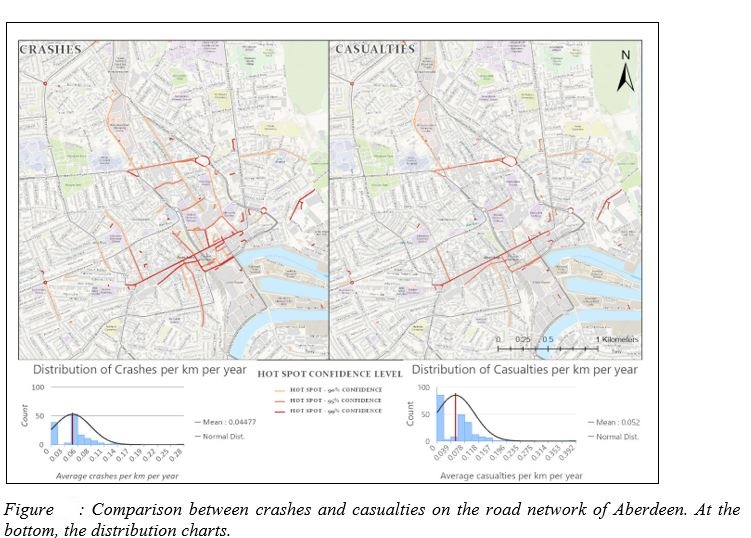
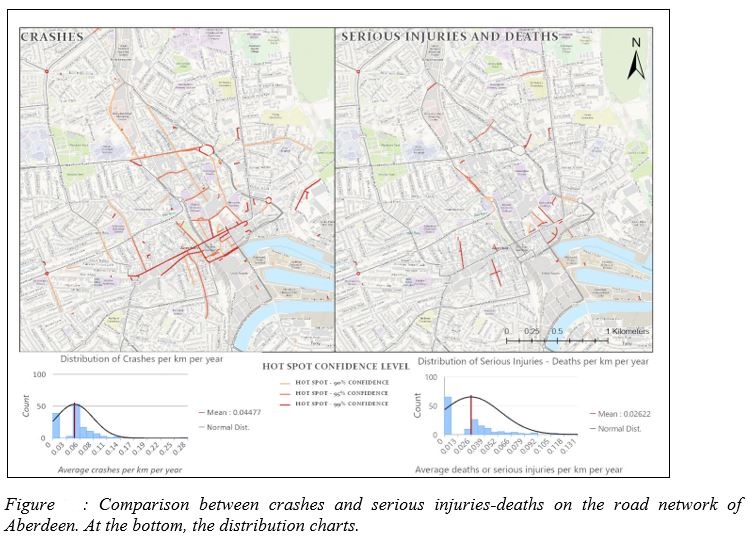
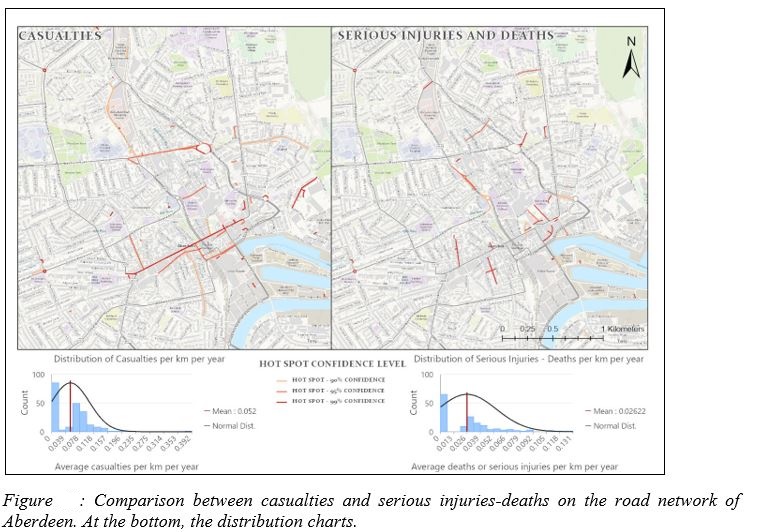
Accident hot spots comparison
Temporal Distributions
Accident Hot Spots and EMS Service Areas Comparison
D ) Poster
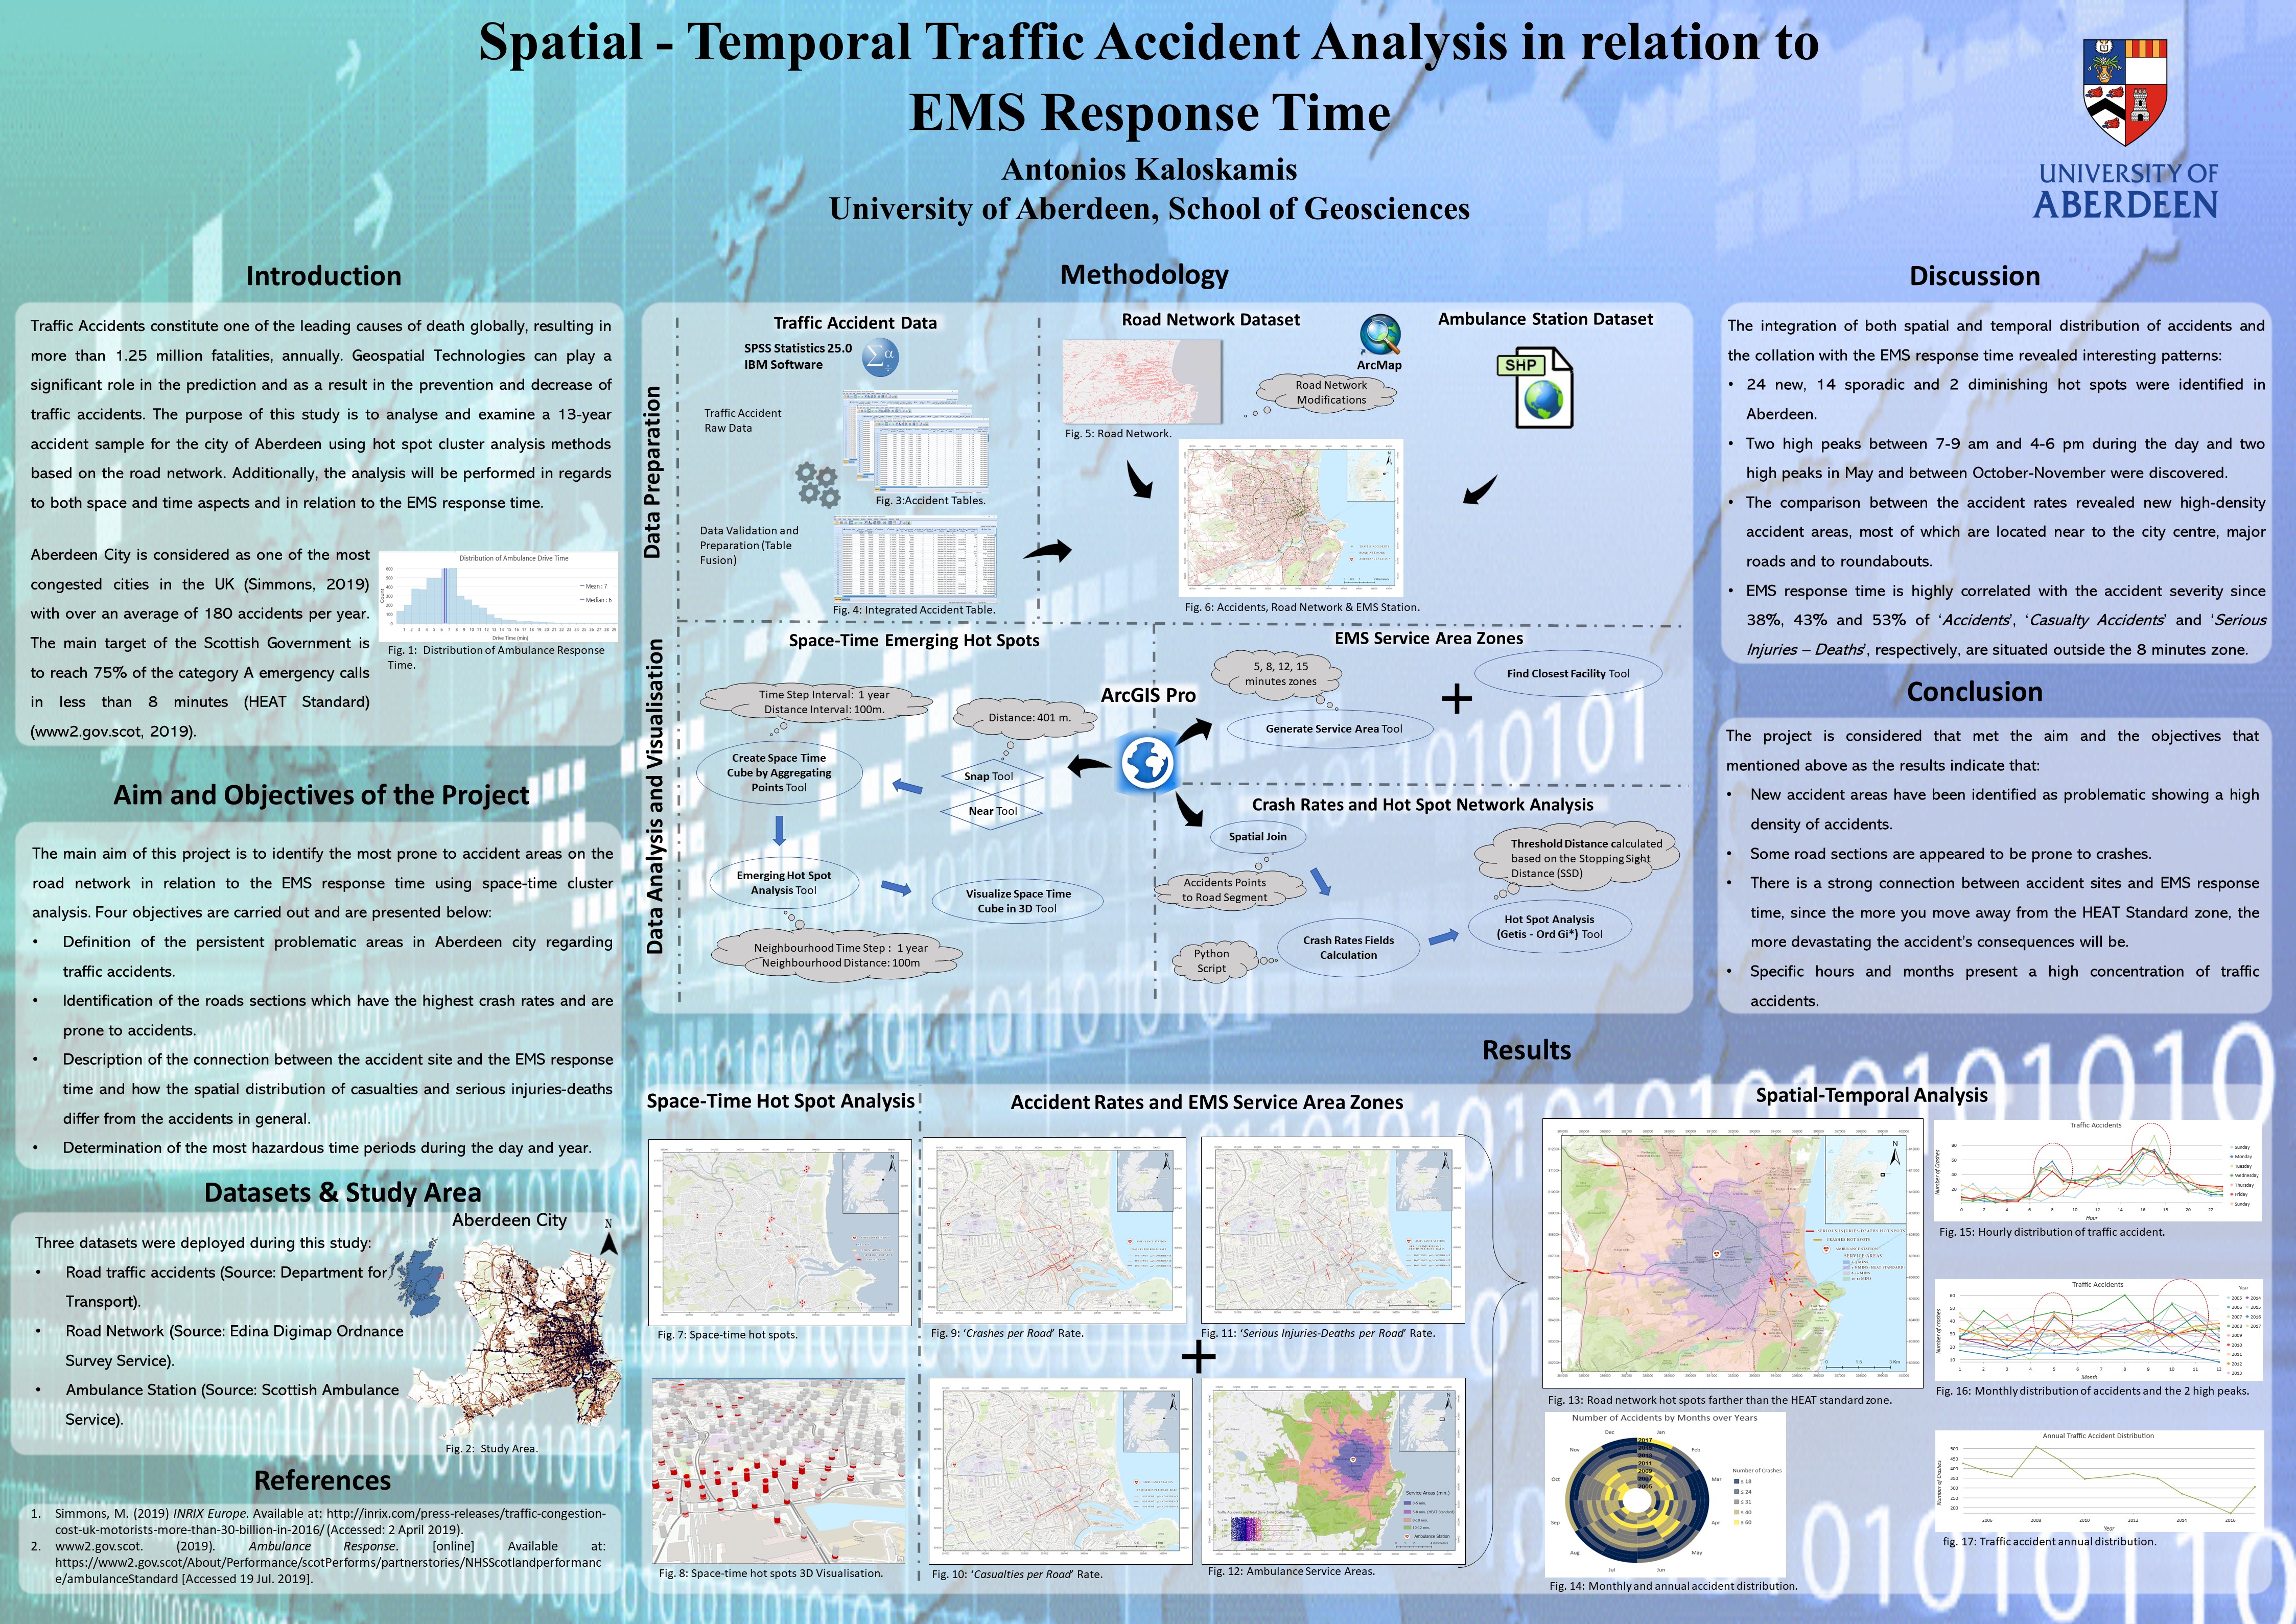 Fig. 6: Dissertation Poster
—————————————————————-
Heads-Up Digitization of the Cruickshank Botanic Garden in Aberdeen, UK.
Description
Traffic accidents constitute one of the dominant causes of death globally, influencing the welfare of modern society significantly. Aberdeen City is considered as one of the most traffic-congested cities in the UK, resulting in more than 180 incidents per year for the last 10-year period. The purpose of this study is to perform an accidents cluster analysis in the City of Aberdeen by examining both time and space aspects in relation to the Emergency Medical Services (EMS) response time. Performing network cluster analysis, new space-time accident hot spots are detected on the road network and then a composite examination between those hot spots and the EMS response time is performed.
Throughout the performed analysis and examination of the traffic accident data, some new accident trends have been identified, during the last few years. Moreover, a high density of accidents takes place during specific day hours and months. Finally, most of the hot spots are located within the boundaries of the HEAT standard of 8 minutes, constituting the EMS station ideally situated. However, an emphasis should be given on those hot spots located farther than the 8-minutes zones, and further policies should be deployed against those prone areas.